- Dynamic Data Analysis and Visualization Framework for Formula 1 Racing
A framework that transforms Formula 1 telemetry into interactive, artistic 3D visualizations reflecting driver emotions.
- Client
- Thesis
- Year
- Service
- Python, FastF1, Three.js, WebGL
Overview
This is framework that transforms Formula 1 telemetry data into artistic, interactive visualizations. Utilizing the FastF1 library, the system processes high-frequency race data to quantify five driver emotions:
- Aggressiveness
- Confidence
- Pressure
- Risk-taking
- Frustration.
These emotions are derived per lap using mathematical models that incorporate corrections for fuel load and tire degradation.
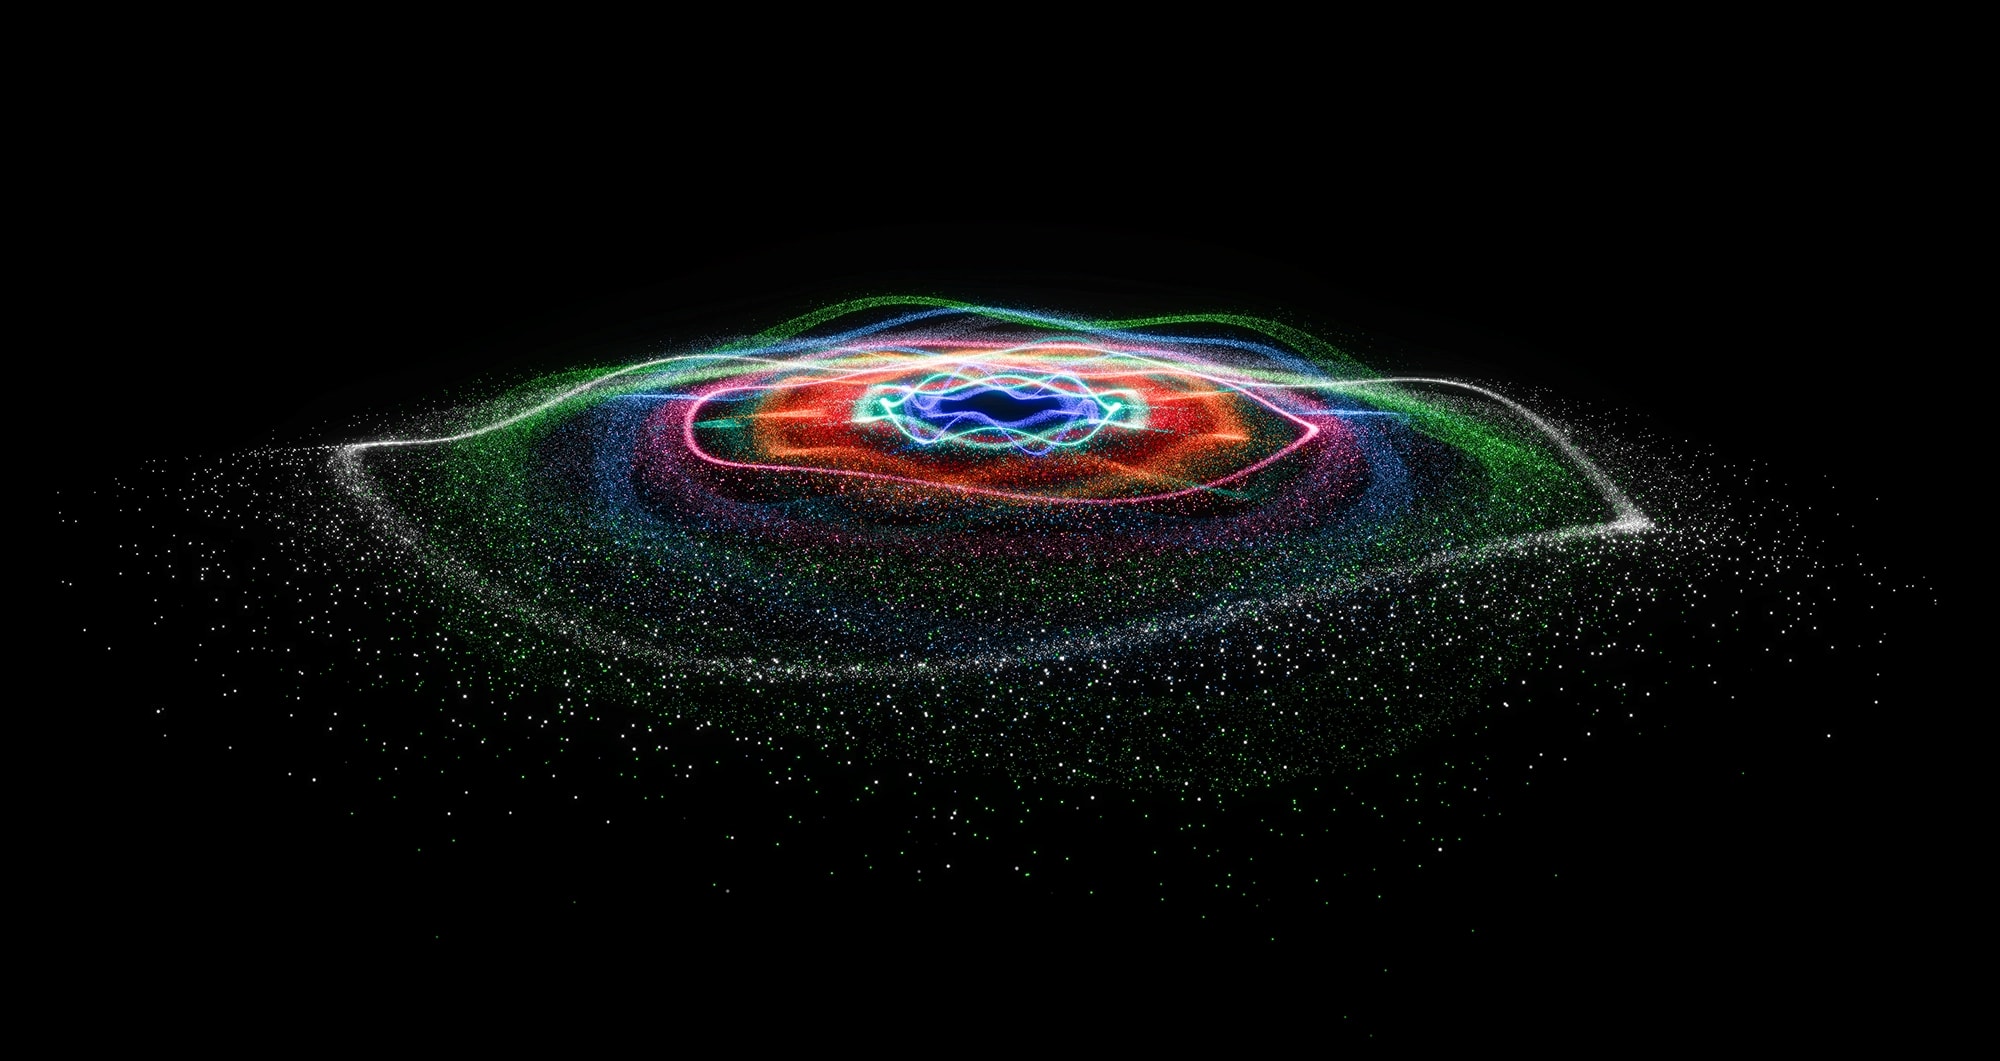
The framework simulates real-time race feeds from historical sessions and renders the results as generative 3D artworks via WebGL and Three.js.
The 2021 Abu Dhabi Grand Prix serves as the primary case study.
Linking Emotions to Movements:
- Wobble amplitude linked to Aggressiveness
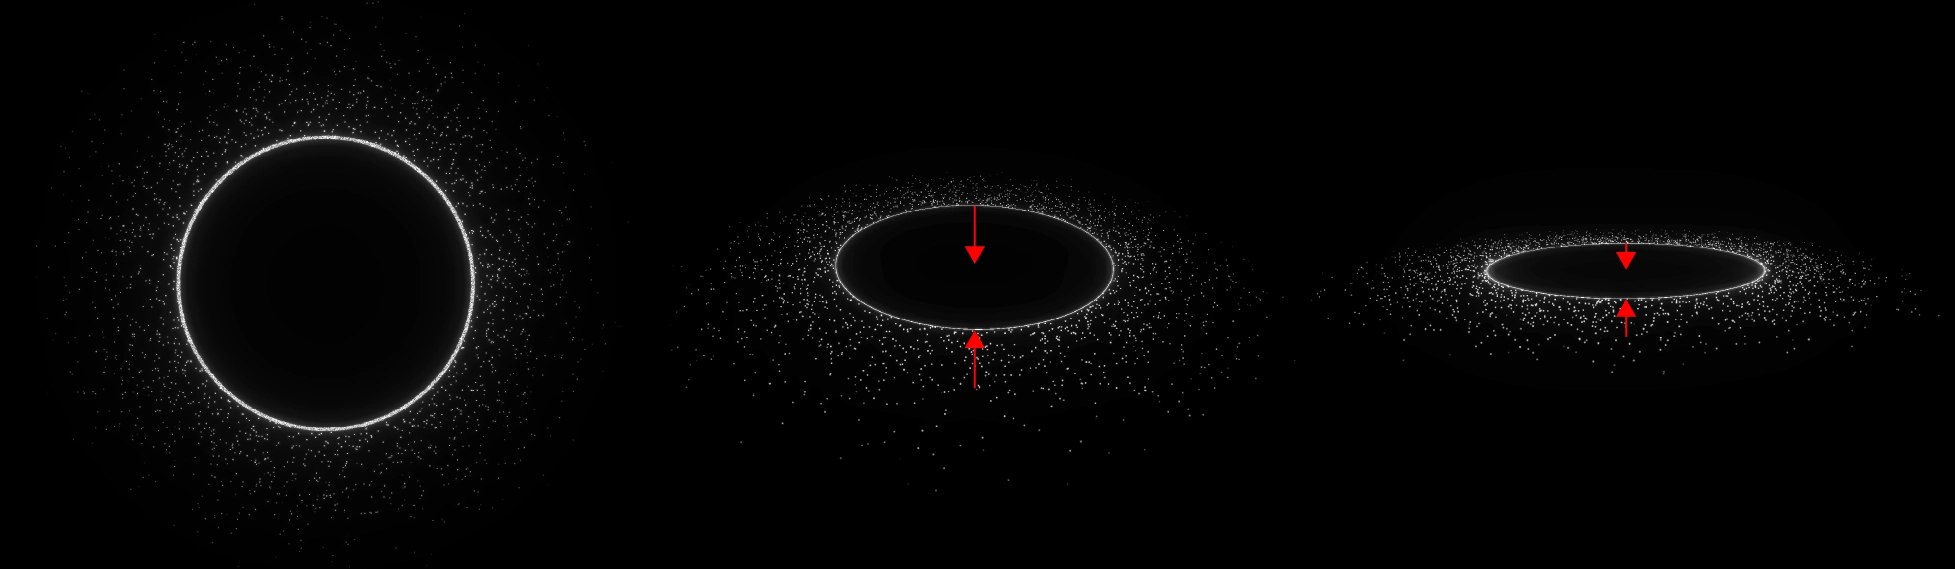
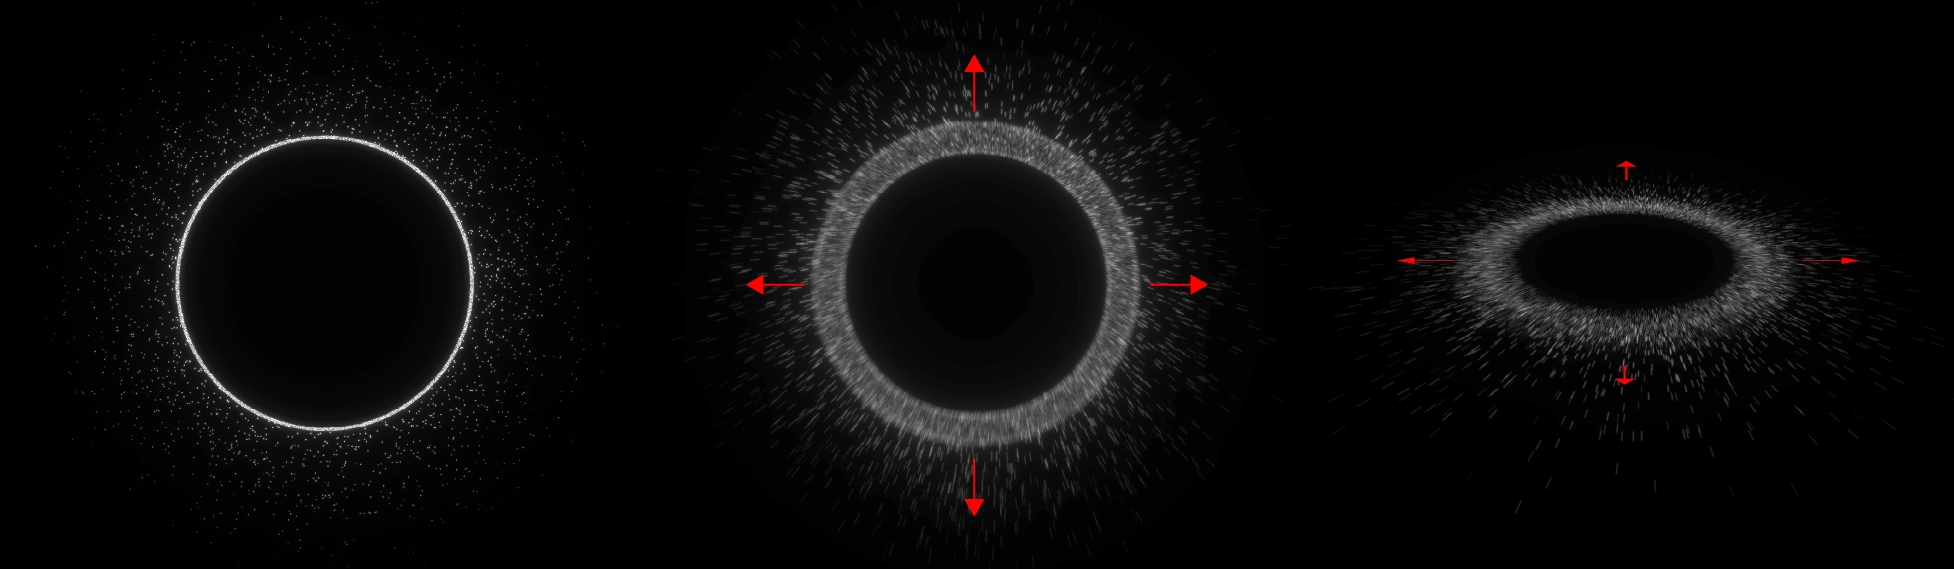
- Oscillation amplitude linked to Confidence

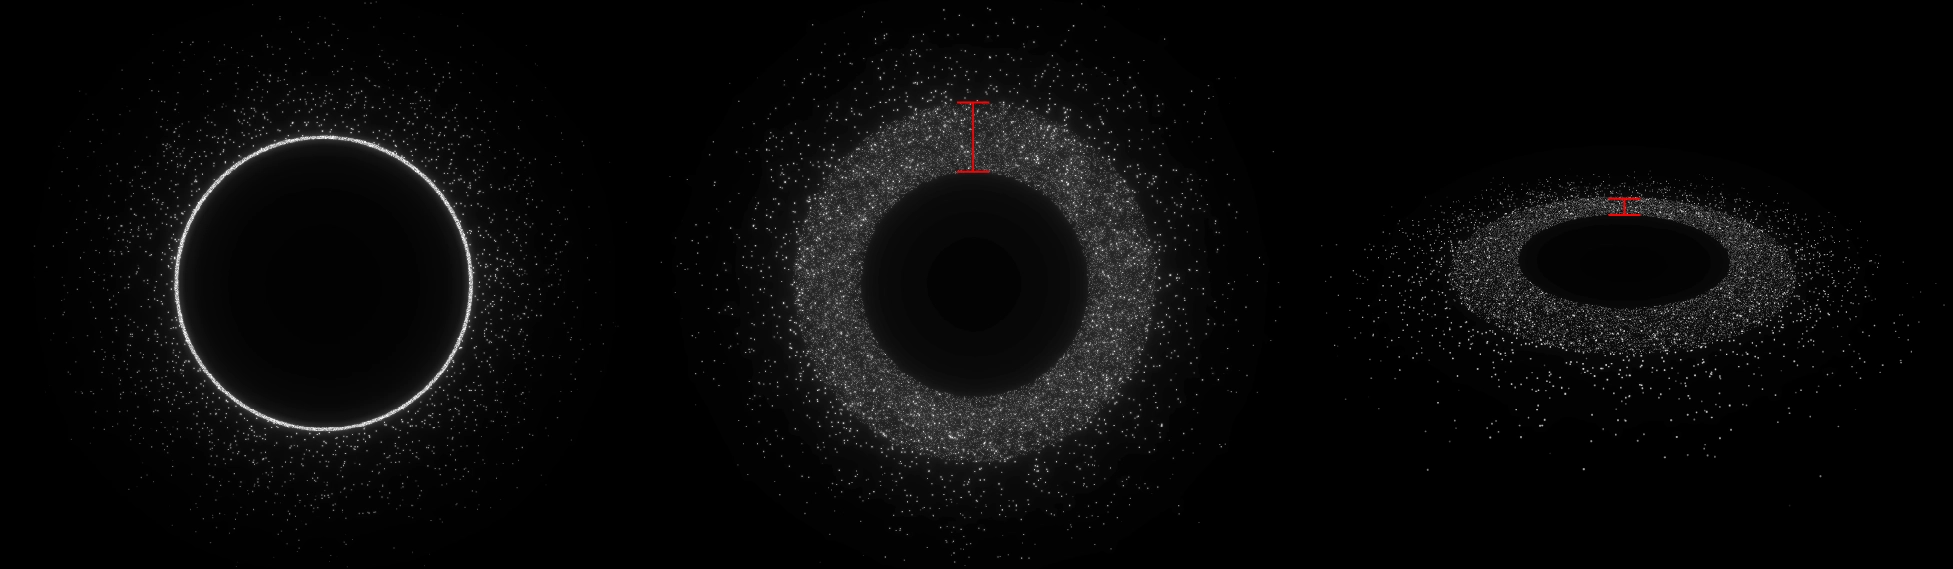
- Thickness linked to Pressure
- Particle shakiness linked to Risk-Taking
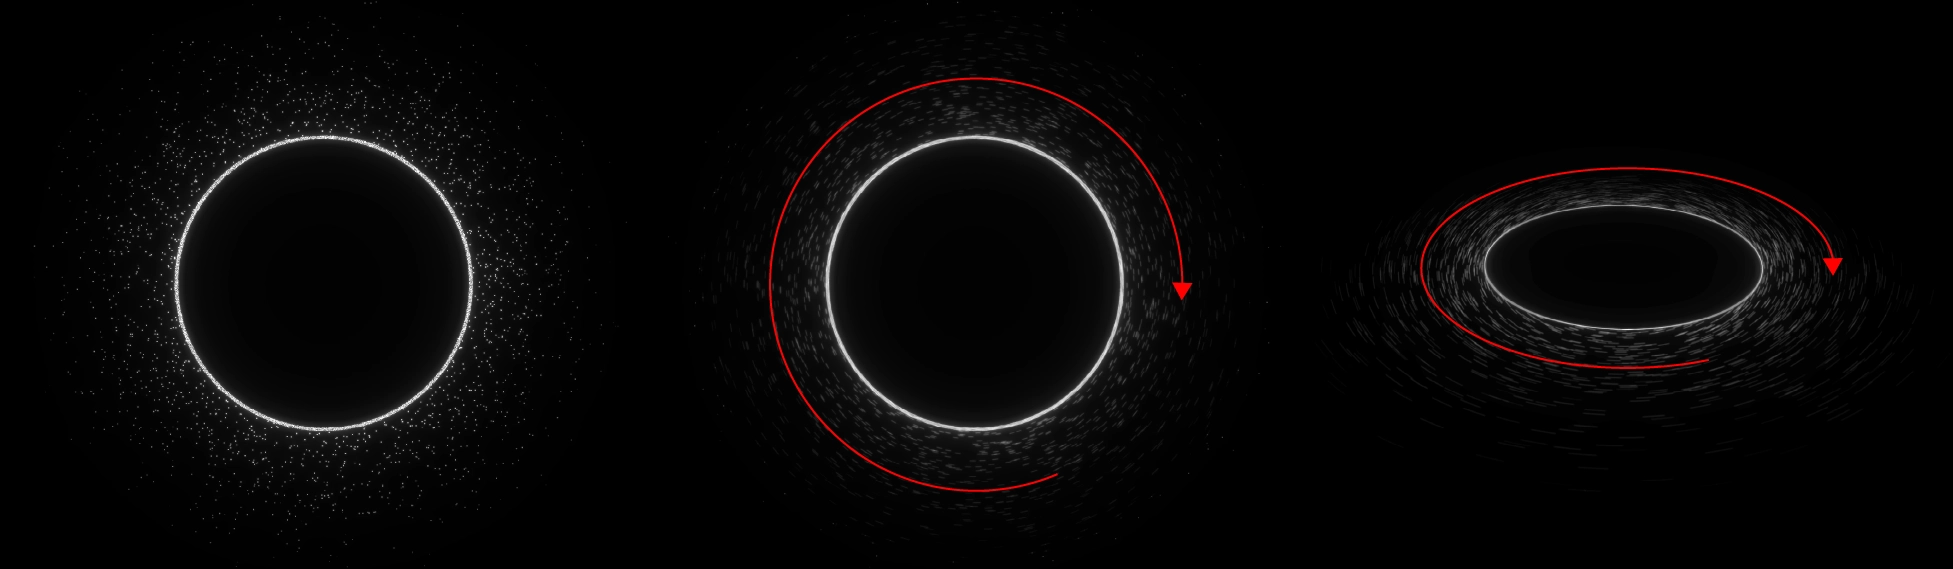
- Orbital Speed linked to Frustration
Interactive
Experience the real-time emotion data visualization. Each ring represents a driver's emotional state during Lap 31 of the 2021 Abu Dhabi Grand Prix. You can interact with the visualization by dragging to rotate the camera view.
Tools Used
- Three.js
- Python
- WebGL
- HTML
- FastF1